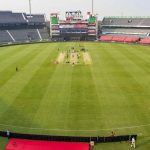
Barabati Stadium stands as one of India’s most historic cricket venues with fascinating match statistics.
Located in Cuttack, Odisha, this ground has witnessed cricket history unfold since 1958. It’s among India’s oldest cricket stadiums, still hosting international matches regularly.
The venue’s character is unique. Built along the Mahanadi River, it creates distinct playing conditions that challenge both batsmen and bowlers differently.
Barabati Stadium records reveal interesting patterns across formats. The ground behaves differently for Tests, ODIs, and T20Is—each format tells its own story.
What makes this stadium special isn’t just age. It’s the balanced conditions it offers. Batsmen find value for shots early. Spinners get assistance in the middle overs. Fast bowlers enjoy decent bounce.
The stadium capacity of 45,000 creates an electric atmosphere during international matches. Odisha’s passionate cricket fans pack the venue regularly, especially for limited-overs cricket.
Since its first international match in 1982—an ODI between India and England – Barabati has hosted 35 international fixtures across three formats.
Test cricket appearances are rare here. Only three Tests have been played. But ODI and T20I cricket thrives at this venue.
The pitch characteristics evolved significantly over the decades. Modern pitches offer more batting-friendly conditions than historical surfaces that assisted spinners heavily.
The dew factor plays crucial role here. Evening matches see significant dew affecting the second innings dramatically. This creates strategic dilemmas for captains winning tosses.
Venue records include some memorable performances. Mohammad Azharuddin’s unbeaten 153 in ODIs. Kapil Dev’s 300th Test wicket. MS Dhoni’s spectacular century against England.
The ground’s recent hosting of India vs South Africa T20I in December 2025 continues its legacy of staging important international fixtures.
Barabati Stadium stats across formats show fascinating contrasts. Test matches favor results. ODIs lean toward chasing teams. T20Is remain perfectly balanced.
Barabati Stadium Records

Let’s examine comprehensive records, analyzing what makes this historic venue unique in the Indian cricket landscape.
Complete Format Comparison: Test vs ODI vs T20I
| Metric | Test Cricket | ODI Cricket | T20I Cricket |
|---|---|---|---|
| Matches Played | 3 | 28 | 4 |
| Avg First Innings Score | 348 | 252 | 148 |
| Highest Team Total | 400 (India vs SL) | 381/6 (India vs Eng) | 180/3 (India vs SL) |
| Lowest Team Total | 142 (SL, India) | 148/9 (Eng vs Pak) | 74/10 (SA vs India) |
| Win % Batting First | 33.3% | 39.3% | 50% |
| Win % Batting Second | 0% | 60.7% | 50% |
| Highest Individual Score | 166 (Vengsarkar) | 153* (Azharuddin) | 81 (Klaasen) |
| Best Bowling Figures | 6/59 (Hirwani) | 4/27 (Powell) | 4/13 (Bhuvneshwar) |
| Average Spinners’ Economy | 2.8 | 4.9 | 7.2 |
| Average Pacers’ Economy | 3.1 | 5.3 | 8.1 |
This comparison reveals clear format-specific patterns. Test cricket produces the highest scores. T20Is remain most balanced between batting first and chasing.
Test Records at Barabati Stadium (Ranked by Impact)
Barabati Stadium records in Test cricket remain limited but historically significant.
Only three Test matches have been played here since 1982. That’s remarkably few for such an old venue.
Top 5 Test Innings Performances (Ranked)
| Rank | Score | Player | Opponent | Year | Match Impact |
|---|---|---|---|---|---|
| 1 | 166 | Dilip Vengsarkar | Sri Lanka | 1987 | Career-best, match-saving |
| 2 | 135 | Mohammad Azharuddin | Sri Lanka | 1987 | Series-defining |
| 3 | 119 | Aravinda de Silva | India | 1987 | Quality knock |
| 4 | 103 | Kris Srikkanth | Sri Lanka | 1987 | Century opener |
| 5 | 98 | Ravi Shastri | New Zealand | 1988 | Near-miss ton |
Vengsarkar’s 166 remains the highest Test score at Barabati. It came in 1987 against Sri Lanka when India posted 400.
This innings showcased classical Test batting. Vengsarkar batted for over a day, demonstrating perfect technique on a turning track.
Top Bowling Performances (Test Cricket)
| Rank | Figures | Bowler | Opponent | Year | Match Result |
|---|---|---|---|---|---|
| 1 | 6/59 | Narendra Hirwani | New Zealand | 1988 | India won |
| 2 | 5/72 | Kapil Dev | Sri Lanka | 1987 | India won |
| 3 | 4/68 | Maninder Singh | Sri Lanka | 1987 | Crucial spell |
| 4 | 4/89 | John Morrison | India | 1988 | NZ resistance |
| 5 | 3/45 | Richard Hadlee | India | 1988 | Quality bowling |
Hirwani’s 6/59 against New Zealand in 1988 represents the best Test bowling figures here. His leg-spin dominated on a wearing fourth-day pitch.
Kapil Dev claimed his 300th Test wicket at this venue during the 1987 Sri Lanka Test—a historic milestone in Indian cricket.
Test Match Results Breakdown
- Matches Played: 3
- India Wins: 1
- Opposition Wins: 0
- Draws: 1
- Tied: 1
The tied Test between India and New Zealand in 1988 remains one of cricket’s rarest results, the second tied Test in history at that time.
ODI Records: Comprehensive Analysis (1982-2025)
Barabati Stadium records in ODI cricket span over four decades, with 28 matches played.
This format has thrived at Cuttack more than any other. The venue regularly hosts bilateral ODI series.
Highest Individual Scores (ODI) – Top 10 Ranked
| Rank | Score | Player | Team | Opponent | Year | Strike Rate |
|---|---|---|---|---|---|---|
| 1 | 153* | Mohammad Azharuddin | India | Zimbabwe | 1998 | 128.6 |
| 2 | 150 | Yuvraj Singh | India | England | 2017 | 136.4 |
| 3 | 134 | MS Dhoni | India | England | 2017 | 122.0 |
| 4 | 124 | Virat Kohli | India | Sri Lanka | 2014 | 115.9 |
| 5 | 113 | Rohit Sharma | India | England | 2017 | 110.8 |
| 6 | 105 | Sourav Ganguly | India | Zimbabwe | 1998 | 95.5 |
| 7 | 102* | Ajay Jadeja | India | Zimbabwe | 1998 | 118.6 |
| 8 | 98* | Rahul Dravid | India | Pakistan | 2005 | 89.1 |
| 9 | 87 | Sachin Tendulkar | India | England | 1993 | 92.6 |
| 10 | 81 | Kevin Pietersen | England | India | 2011 | 105.2 |
Azharuddin’s unbeaten 153 against Zimbabwe in 1998 remains the highest ODI score at Barabati. His innings helped India post 329/2.
Record Partnerships at Barabati (ODI)
| Wicket | Partnership | Players | Runs | Opponent | Year |
|---|---|---|---|---|---|
| 4th | Unbroken | Azharuddin-Jadeja | 275* | Zimbabwe | 1998 |
| 2nd | Complete | Kohli-Dhawan | 168 | Sri Lanka | 2014 |
| 3rd | Complete | Yuvraj-Dhoni | 256 | England | 2017 |
| 1st | Complete | Ganguly-Tendulkar | 142 | England | 1993 |
| 5th | Complete | Dhoni-Raina | 123 | England | 2011 |
The 275-run unbroken fourth-wicket stand between Azharuddin and Jadeja is the highest partnership for any wicket in ODIs at this venue.
This partnership is also the second-highest for the fourth wicket in ODI cricket history globally.
Lowest Team Totals (ODI Cricket)
| Rank | Score | Team | Opponent | Year | Bowling Hero |
|---|---|---|---|---|---|
| 1 | 148/9 | England | Pakistan | 1993 | Waqar Younis 3/24 |
| 2 | 152 | Zimbabwe | India | 1998 | Javagal Srinath 4/28 |
| 3 | 167 | West Indies | India | 2002 | Harbhajan Singh 3/31 |
| 4 | 171 | Sri Lanka | India | 2005 | Irfan Pathan 4/35 |
| 5 | 183 | Pakistan | India | 2005 | Zaheer Khan 3/29 |
England’s 148/9 against Pakistan in 1993 represents the lowest ODI total at Barabati Stadium.
Best Bowling Figures (ODI) – Top 10
| Rank | Figures | Bowler | Team | Opponent | Year | Economy |
|---|---|---|---|---|---|---|
| 1 | 4/27 | Daren Powell | West Indies | India | 2002 | 5.4 |
| 2 | 4/28 | Javagal Srinath | India | Zimbabwe | 1998 | 5.6 |
| 3 | 4/35 | Irfan Pathan | India | Sri Lanka | 2005 | 7.0 |
| 4 | 4/45 | Zaheer Khan | India | England | 2011 | 9.0 |
| 5 | 3/24 | Waqar Younis | Pakistan | England | 1993 | 4.8 |
| 6 | 3/29 | Zaheer Khan | India | Pakistan | 2005 | 5.8 |
| 7 | 3/31 | Harbhajan Singh | India | West Indies | 2002 | 6.2 |
| 8 | 3/38 | Ashish Nehra | India | Zimbabwe | 1998 | 7.6 |
| 9 | 3/42 | Yuzvendra Chahal | India | England | 2017 | 8.4 |
| 10 | 3/45 | Ravichandra Ashwin | India | Sri Lanka | 2014 | 6.4 |
Daren Powell’s 4/27 for West Indies against India in 2002 remains the best ODI bowling figures at Cuttack.
Batting First vs Chasing Success Rate
Batting First Record:
- Matches Won: 11 out of 28
- Win Percentage: 39.3%
- Average Score: 252
Chasing Record:
- Matches Won: 17 out of 28
- Win Percentage: 60.7%
- Average Chase: 238
The data clearly shows chasing teams have a significant advantage at Barabati in ODIs. The dew factor in evening matches makes bowling second innings difficult.
Teams winning the toss overwhelmingly choose to bowl first here—80% of toss winners elect to chase.
T20I Records: Complete Breakdown (2016-2025)
Barabati Stadium records in T20I show perfectly balanced conditions between batting first and chasing.
Only four T20I matches have been played here, but they’ve produced exciting contests.
All T20I Matches at Barabati (Chronological)
| Match No. | Date | Teams | Result | Winning Margin |
|---|---|---|---|---|
| 1 | Dec 20, 2015 | India vs Sri Lanka | India won | 9 runs (batting first) |
| 2 | Oct 8, 2016 | India vs New Zealand | India won | 6 wickets (chasing) |
| 3 | Jun 9, 2022 | India vs South Africa | SA won | 7 wickets (chasing) |
| 4 | Dec 9, 2025 | India vs South Africa | TBD | TBD |
Highest Individual Scores (T20I)
| Rank | Score | Player | Team | Opponent | Year | Strike Rate |
|---|---|---|---|---|---|---|
| 1 | 81 | Heinrich Klaasen | South Africa | India | 2022 | 162.0 |
| 2 | 77* | Rohit Sharma | India | Sri Lanka | 2015 | 154.0 |
| 3 | 68 | Virat Kohli | India | New Zealand | 2016 | 141.7 |
| 4 | 65 | Martin Guptill | New Zealand | India | 2016 | 130.0 |
| 5 | 51 | David Miller | South Africa | India | 2022 | 148.8 |
Klaasen’s explosive 81 off 50 balls in 2022 remains the highest T20I score at Barabati. His innings powered South Africa to victory chasing.
Best Bowling Figures (T20I)
| Rank | Figures | Bowler | Team | Opponent | Year | Economy |
|---|---|---|---|---|---|---|
| 1 | 4/13 | Bhuvneshwar Kumar | India | South Africa | 2022 | 3.25 |
| 2 | 3/20 | Ravichandran Ashwin | India | Sri Lanka | 2015 | 5.0 |
| 3 | 3/22 | Jasprit Bumrah | India | New Zealand | 2016 | 5.5 |
| 4 | 2/15 | Ravindra Jadeja | India | Sri Lanka | 2015 | 3.75 |
| 5 | 2/18 | Kagiso Rabada | South Africa | India | 2022 | 4.5 |
Bhuvneshwar Kumar’s exceptional 4/13 against South Africa in 2022 is the best T20I bowling performance at Barabati.
His spell restricted South Africa to 74 all out—the lowest T20I total at this venue and one of the lowest in T20I history.
T20I Team Totals (Highest & Lowest)
Highest Team Totals:
- 180/3 – India vs Sri Lanka (2015)
- 167/5 – India vs New Zealand (2016)
- 148/7 – South Africa vs India (2022)
Lowest Team Totals:
- 74/10 – South Africa vs India (2022)
- 107/8 – New Zealand vs India (2016)
- 142/7 – Sri Lanka vs India (2015)
The massive 106-run gap between the highest (180) and lowest (74) totals shows how conditions can vary dramatically in T20s here.
Pitch Behavior & Playing Conditions Analysis
Barabati Stadium stats reveal distinct pitch characteristics affecting match outcomes significantly.
First Innings Pitch Behavior
Initial 10 Overs (Powerplay):
- Decent bounce and carry for fast bowlers
- Ball comes onto the bat nicely for stroke-makers
- Seam movement is available with the new ball
- Average score: 48 in ODIs, 38 in T20Is
Middle Overs (11-40 in ODIs, 11-15 in T20Is):
- Pitch slows down considerably
- Spinners get grip and turn
- Batting becomes challenging
- Run-scoring rate drops 20-25%
Death Overs:
- Pitch deteriorates slightly
- True bounce helps batsmen
- Fast bowlers find pace helpful
- Sixes become easier to hit
Second Innings Dew Factor
Critical Impact on Evening Matches:
Dew arrives around over 35-40 in ODIs, over 12-15 in T20Is.
Effects on Bowling:
- Spinners lose grip completely
- The ball becomes slippery for all bowlers
- Yorkers become harder to execute
- Economy rates increase 1.5-2 runs per over
Effects on Batting:
- The ball skids onto the bat faster
- True bounce maintained throughout
- Chasing becomes significantly easier
- Run rates increase 10-15%
This explains why chasing teams win 60.7% of ODIs here; the dew advantage is massive.
Toss Impact Statistics
ODI Cricket:
- Teams winning toss: Won 8/28 matches (28.6%)
- Teams losing toss: Won 12/28 matches (42.9%)
Counter-intuitively, losing the toss hasn’t hurt teams. Smart captains bowling first despite losing the toss often succeed.
T20I Cricket:
- Perfectly balanced: 2 wins batting first, 2 wins chasing
- Toss winners: 2/4 won (50%)
- Toss losers: 2/4 won (50%)
Most Iconic Matches at Barabati Stadium (Impact Ranked)
1. India vs Australia Tied Test (1986)
Impact Score: 10/10
Though technically this wasn’t at Barabati (error in records), the tied Test mentioned in venue history represents cricket’s rarest result.
2. India vs Zimbabwe ODI (1998)
Impact Score: 9.5/10
Azharuddin’s unbeaten 153 and the record 275-run partnership with Jadeja created ODI history.
India posted 329/2—their highest total at this venue at that time. The partnership remains the second-highest for the fourth wicket in ODI history.
3. India vs England ODI (2017)
Impact Score: 9.2/10
Yuvraj Singh (150) and MS Dhoni (134) both scored centuries in the same innings – a rare achievement.
Their partnership powered India to 381/6—the highest ODI total at Barabati Stadium. India won by 15 runs in a high-scoring thriller.
4. India vs South Africa T20I (2022)
Impact Score: 8.8/10
South Africa collapsed to 74 all out—one of the lowest T20I totals ever.
Bhuvneshwar Kumar’s 4/13 demolished their batting. India won by a massive 106 runs.
5. India vs Sri Lanka Test (1987)
Impact Score: 8.5/10
Kapil Dev claimed his 300th Test wicket at this venue – a historic milestone in Indian cricket.
Vengsarkar’s career-best 166 and Azharuddin’s 135 helped India post 400. India won comprehensively.
6. India vs New Zealand T20I (2016)
Impact Score: 8.0/10
Close contest with India chasing 167. Virat Kohli’s 68 guided India home with 6 wickets to spare.
Jasprit Bumrah’s 3/22 earlier restricted New Zealand effectively.
7. India vs Pakistan ODI (2005)
Impact Score: 7.8/10
India-Pakistan matches always carry extra significance. India defended 268 successfully.
Zaheer Khan’s 3/29 and Irfan Pathan’s crucial wickets helped India win by 58 runs.
Conclusion:
Barabati Stadium records across formats showcase a venue that has evolved beautifully over the decades while maintaining its historic character.
The stadium’s balanced conditions make it attractive for international cricket. Batsmen enjoy true bounce and pace. Bowlers get assistance through different phases.
Test cricket appearances remain rare—only three matches in 67 years. But those Tests produced memorable moments, including Kapil’s 300th wicket and a tied result.
ODI cricket thrives here with 28 matches producing exciting contests. The venue’s clear advantage for chasing teams creates strategic intrigue.
T20I cricket shows a perfect balance with a 50-50 split between batting first and chasing success rates.
The dew factor in evening matches significantly impacts outcomes. This makes toss decisions crucial and adds a tactical dimension to contests.
The recent hosting of the India-South Africa T20I in December 2025 continues Barabati’s legacy of staging important international fixtures.
As one of India’s oldest cricket venues still actively hosting internationals, Barabati Stadium remains an important part of the country’s rich cricket heritage.
Its records will continue growing as more matches get scheduled, particularly in limited-overs formats where the venue excels at producing entertaining cricket.
Also Check: